
Financial markets fluctuate between two primary trends: bull markets and bear markets. A general rule of thumb is to look for movements in investment prices of 20% or more in either direction, held over an extended period, i.e. a rise or fall should be over at least two months (US Securities and Exchange Commission). These terms describe the overall direction of a market and influence investor behaviour.
Bull Markets occur during an extended period of rising prices – a broad definition is that a bull market begins when prices have risen by 20% from a recent low. Think of a bull thrusting its horns upwards which is a representation of the upward movement of the market. Bull markets in stocks typically take place against the backdrop of a strong economy, the Gross Domestic Product (GDP) growth rate is positive, corporate profits rise and unemployment falls. During bull markets investor optimism is high, and demand for stocks outpaces supply, driving prices higher.
Bear Markets are the opposite of bull markets and are characterized by a prolonged decline in asset prices, typically a drop of 20% or more from recent highs over an extended period. A common representation is how a bear swipes its claws downwards reflective of the downward movement in price seen in a bear market. It signals investor pessimism and can be triggered by economic downturns, recessions, or market shocks. During bear markets, many investors sell to minimize losses. Bear markets in stocks take place when prices are falling and there is a slowing economy with a decrease in GDP, falling corporate profits and rising unemployment. Other factors that can lead to bear markets are bubbles (e.g. the dot-com bubble which burst in 2001). During bear markets there is negative economic data and a lack of confidence amongst investors. Pessimistic investors may decide to sell their assets to avoid losing money or to stem existing losses creating a situation where supply is greater than demand, driving prices lower.
Occasionally, prices will rise temporarily during a bear market. This is known as a Bear Market Rally. Though it may seem like the start of a recovery, it’s often short-lived, and the broader downtrend resumes soon after. A Bull Trapoccurs when prices briefly rise during a bear market, tricking investors into believing a bull market is starting. Those who buy during the rise may face losses when prices fall again, realizing the rise was deceptive. A Market Correction refers to a short-term decline of 10% or more in a market that had been rising. It helps “correct” overpriced assets and can be a natural pause before the market continues its upward trend.
Together, these concepts shape the cyclical nature of financial markets and offer valuable insights into investment timing and strategy. Understanding them can help investors navigate volatile conditions.
How Long Do Bull and Bear Markets Last? Historically, bear markets are typically shorter than bull markets. According to Invesco, using data from 1968 to 2020, the average length of a bear market was 349 days, while the average length of a bull market was 1,764 days. The average loss in a bear market was 36.34% and the average gain during a bull market was 180.04%. Longest bull market was between 2009 and 2020, the bull market began as stocks recovered from the Global Financial Crisis of 2007-2008 and ended in March 2020 due to the Coronavirus pandemic. The second longest bull market was between 1990 – 2000, 113 months. The longest bear market in history took place between 1937 and 1942 as the Great Depression continued throughout the 1930s and the threat of war in Europe loomed. Investors may be deterred by the existence and inevitability of bear markets, however such market conditions occur relatively seldom. According to research conducted by Harford Funds, during the last 92 years, markets have been rising 78% of the time, with only about 20 years of bear markets.
The infographic from Visual Capitalist below provides a long-term perspective on stock market cycles, spanning more than six decades. It highlights the alternating periods of bull and bear markets, showing how investor sentiment and economic conditions shape these phases over time.
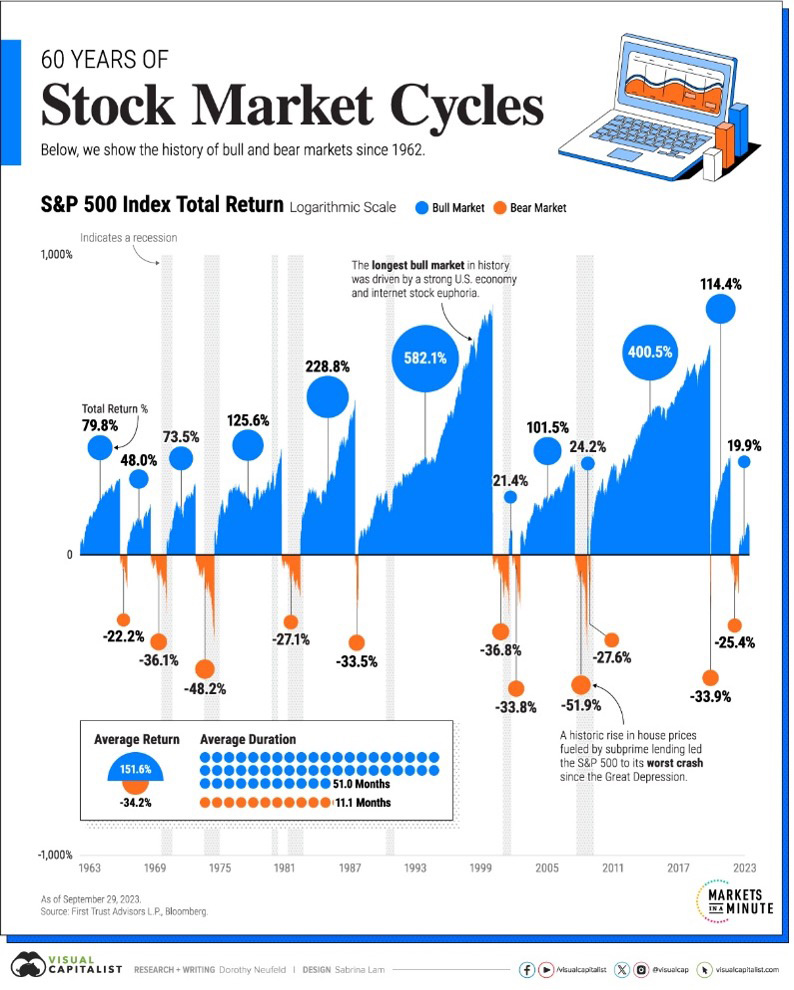
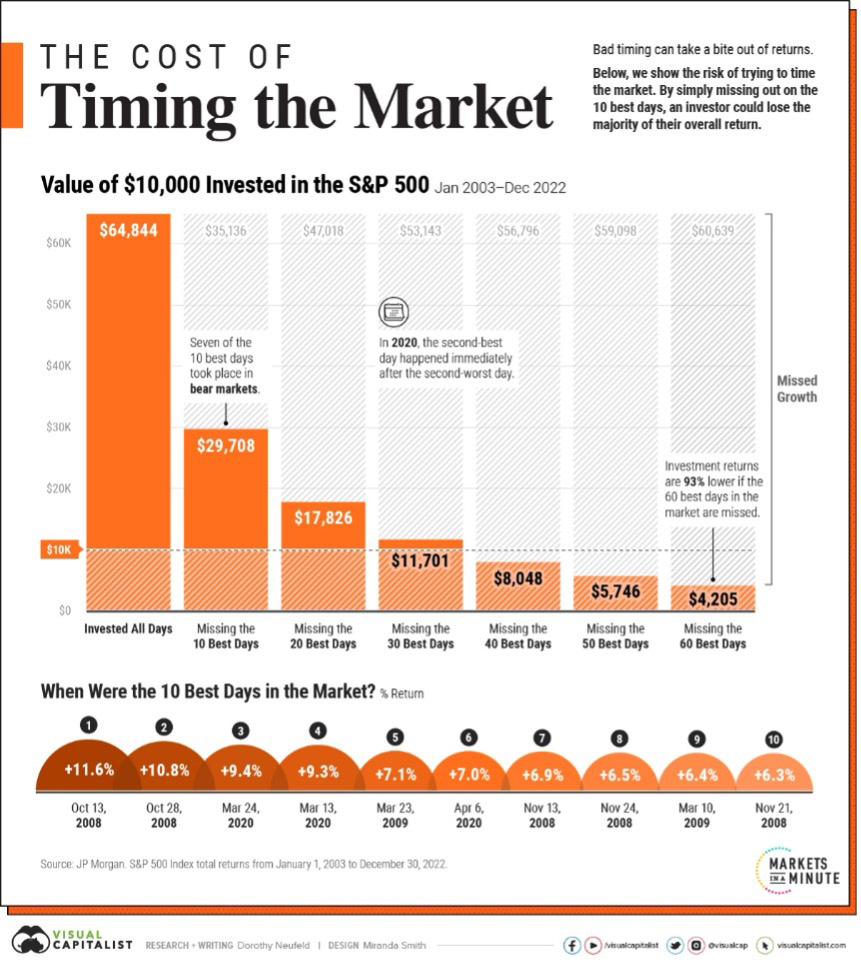
In order to get the best returns from your investment it is time in the market that matters most and remaining invested through different market cycles. Trying to predict the best time to buy-in and sell-out of the market can result in you missing the market’s biggest gains as illustrated in the above infographic. Importantly, the visual makes clear that while downturns are inevitable, markets have historically spent far more time in bull runs than in bear territory.
This long-term resilience serves as a reminder that patient investors who stay the course often benefit most from the market’s enduring upward trend.
All information and views contained within this article is for informational purposes only and the views expressed do not constitute financial advice. U Consulting makes no representations as to the accuracy, completeness or suitability of any information and will not be liable for any errors, omissions or any losses arising from its use. Please consult a professional financial advisor before making any financial decision.
Nothing presented in the article constitutes investment advice, it does not consider the investment objectives, knowledge and experience or financial situation of any person. You should not act on it in any way and are advised to obtain professional advice suitable to your own individual circumstances. The value of your investment may go down as well as up. You may lose some or all of the money you invest. Past performance should not be taken as an indication or guarantee of future performance; neither should simulated performance. The value of securities may be subject to exchange rate fluctuation that may have a positive or adverse effect on the price or income of such securities.
Transform your financial life
Topic – Wealth Management